
Learning Objectives
Following this assignment students should be able to:
- use and create vectorized functions
- use the apply family of functions for iteration
- integrate custom functions with dplyr for iteration
Reading
-
Topics
- Iteration
- Style
-
Readings
Lecture Notes
Iteration using vectorization and apply
Exercises
Vectorized Genus Extraction (15 pts)
The following code extracts the genus from strings that are scientific names (include both genus and species). The
str_extractfunction is from thestringrpackage, which is great for working with strings.waterbird <- "cygnus olor" str_extract(waterbird, "\\w+")str_extractis a vectorized function meaning it can take a multiple species names as input and return one genera for each species.1. Copy and modify the code above to display a vector of genera for the following vector of species names:
waterbirds <- c("cygnus olor", "aix sponsa", "anas acuta")2. Copy the code below to create a data frame and then add a new
genuscolumn to that data frame that contains the just the genus (the first word in each pair). Display the data frame.[click here for output]bird_data <- data.frame(species = c("cygnus olor", "aix sponsa", "anas acuta"))Species Name Capitalization with Apply (15 pts)
You have some data with species names that are stored in capital letters. You want to capitalize them properly so that the genus starts with a capital letter and the other letters are lower case. The
str_to_sentencefunction from thestringrpackage can do this:library(stringr) species <- "CYGNUS OLOR" species_clean <- str_to_sentence(species)1. Use
sapplyandstr_to_sentenceto produce a vector of properly capitalized species names from the following vector of species names:species <- c("CYGNUS OLOR", "AIX SPONSA", "ANAS ACUTA")2. Replace
sapplywithlapplyto get the answer as a list instead of a vector.3. Use
lapplyto get the properly capitalized species and the useunlistto convert the result to a vector.Note: this exercise doesn’t technically require the use of an apply function, but we’re going to use one to keep our first use of apply simple.
[click here for output]Size Estimates Vectorized (20 pts)
This is a followup to Use and Modify.
-
Write a function that takes
lengthas an argument to get an estimate of mass values for the dinosaur Theropoda. Use the equationmass <- 0.73 * length^3.63. Copy the data below into R and pass the entire vector to your function to calculate the estimated mass for each dinosaur.theropoda_lengths <- c(17.8013631070471, 20.3764452071665, 14.0743486294308, 25.65782386974, 26.0952008049675, 20.3111541103134, 17.5663244372533, 11.2563431277577, 20.081903202614, 18.6071626441984, 18.0991894513166, 23.0659685685892, 20.5798853467837, 25.6179254233558, 24.3714331573996, 26.2847248252537, 25.4753783544473, 20.4642089867304, 16.0738256364701, 20.3494171706583, 19.854399305869, 17.7889814608919, 14.8016421998303, 19.6840911485379, 19.4685885050906, 24.4807784966691, 13.3359960054899, 21.5065994598917, 18.4640304608411, 19.5861532398676, 27.084751999756, 18.9609366301798, 22.4829168046521, 11.7325716149514, 18.3758846100456, 15.537504851634, 13.4848751773738, 7.68561192214935, 25.5963348603783, 16.588285389794) -
Rewrite the function to use the equation
mass <- a * length^band takelength,aandbas arguments. Set the default values forato0.73andbto3.63so that the code from (1) still works. Copy the data below into R and call your function using vector of lengths (above) and these vectors ofaandbvalues to estimate the mass for the dinosaurs using different values ofaandb.a_values <- c(0.759, 0.751, 0.74, 0.746, 0.759, 0.751, 0.749, 0.751, 0.738, 0.768, 0.736, 0.749, 0.746, 0.744, 0.749, 0.751, 0.744, 0.754, 0.774, 0.751, 0.763, 0.749, 0.741, 0.754, 0.746, 0.755, 0.764, 0.758, 0.76, 0.748, 0.745, 0.756, 0.739, 0.733, 0.757, 0.747, 0.741, 0.752, 0.752, 0.748)b_values <- c(3.627, 3.633, 3.626, 3.633, 3.627, 3.629, 3.632, 3.628, 3.633, 3.627, 3.621, 3.63, 3.631, 3.632, 3.628, 3.626, 3.639, 3.626, 3.635, 3.629, 3.642, 3.632, 3.633, 3.629, 3.62, 3.619, 3.638, 3.627, 3.621, 3.628, 3.628, 3.635, 3.624, 3.621, 3.621, 3.632, 3.627, 3.624, 3.634, 3.621) -
Create a data frame for this data using
dino_data <- data.frame(theropoda_lengths, a_values, b_values). Usingdplyradd a newmassescolumn to this data frame (usingmutateand your function).
-
Size Estimates By Name Apply (20 pts)
This is a followup to Size Estimates by Name.
Download and import data on dinosaur lengths with species names.
Write a function
get_mass_from_length_by_name()that uses the equationmass <- a * length^bto estimate the size of a dinosaur from its length. This function should take two arguments, thelengthand the name of the dinosaur group. Inside this function useif/else if/elsestatements to check to see if the name is one of the following values and if so setaandbto the appropriate values.- Stegosauria:
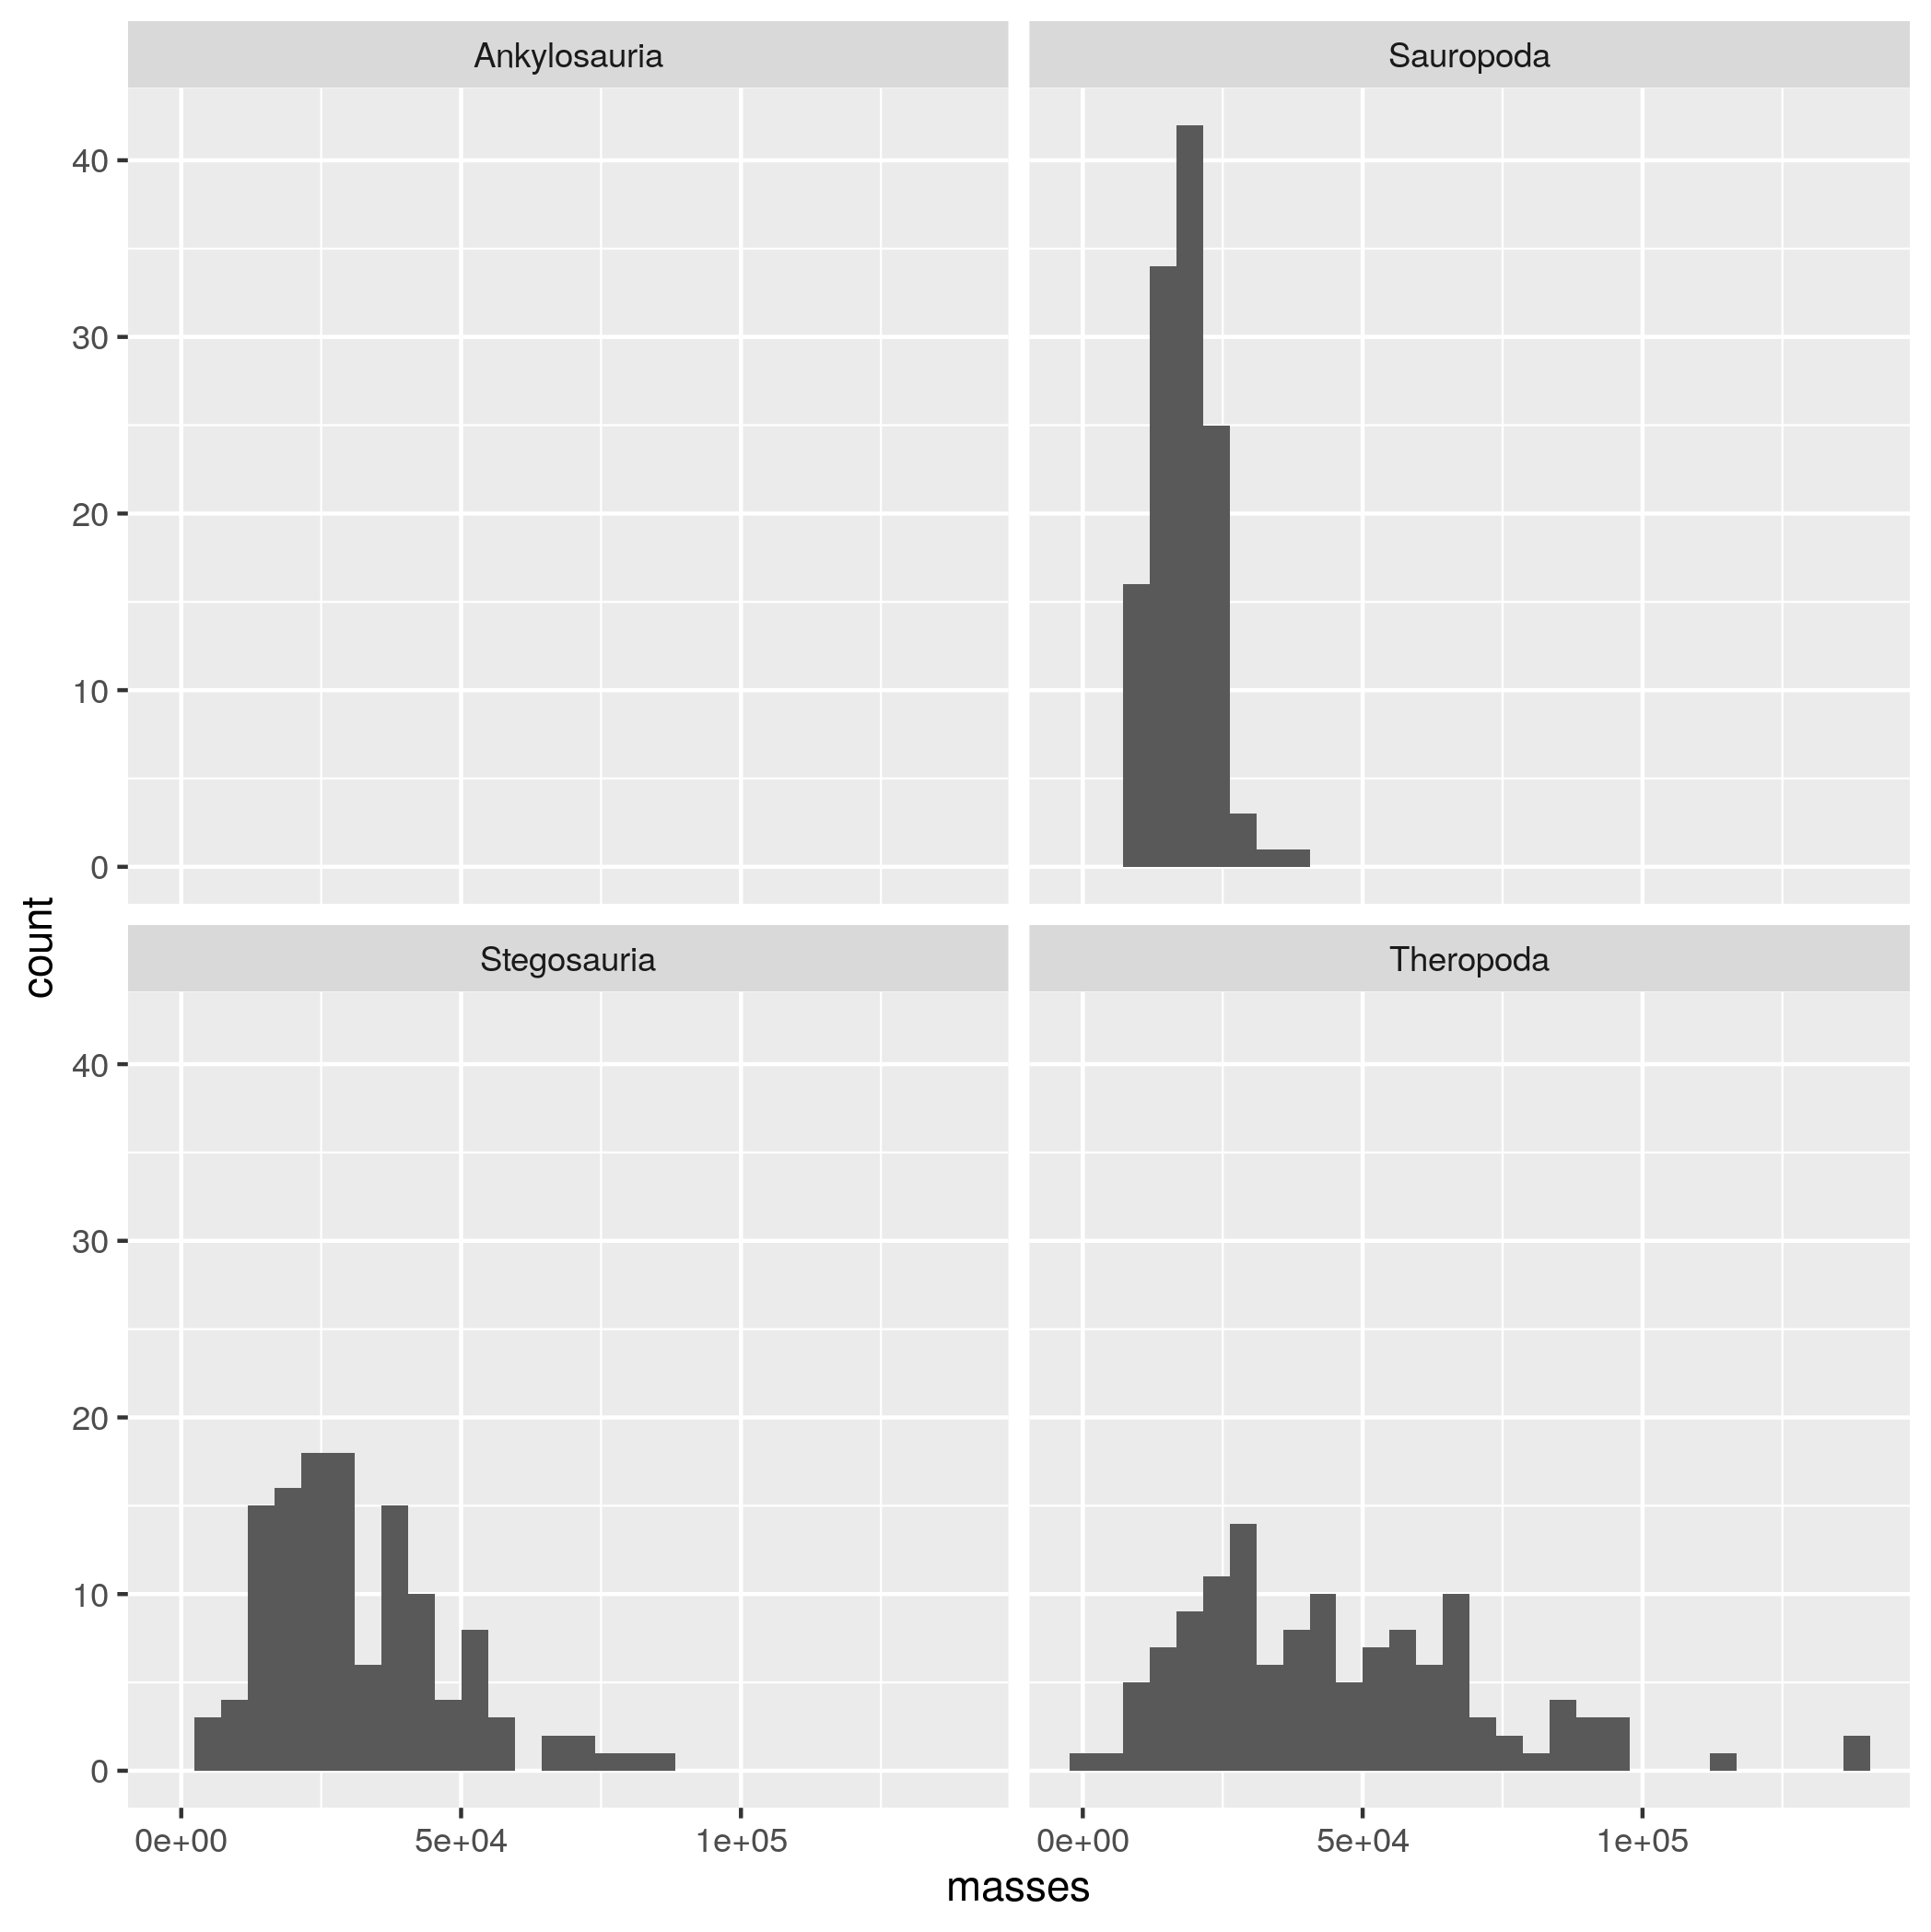
a=10.95andb=2.64(Seebacher 2001). - Theropoda:
a=0.73andb=3.63(Seebacher 2001). - Sauropoda:
a=214.44andb=1.46(Seebacher 2001).
If the name is not any of these values set
aandbtoNA.-
Use this function and
mapplyto calculate the estimated mass for each dinosaur. You’ll need to pass the data tomapplyas single vectors or columns, not the whole data frame. -
Using
dplyradd a newmassescolumn to the data frame (usingrowwise,mutateand your function). -
Make a histogram of of dinosaur lengths with one subplot for each species (using
facet_wrap).
- Stegosauria:
Tree Biomass Challenge (30 pts)
Understanding the total amount of biomass (the total mass of all individuals) in forests is important for understanding the global carbon budget and how the earth will respond to increases in carbon dioxide emissions.
We don’t normally measure the mass of a tree, but take a measurement of the diameter or circumference of the trunk and then estimate mass using equations like M = 0.124 * D2.53.
1. Estimate tree biomass for each species in a 96 hectare area of the Western Ghats in India using the following steps.
- Download the data and load the data into R.
- Write a function that takes a vector of tree diameters as an argument and
returns a vector of tree masses. (Thanks to vector math this function is basically just the equation above). - Create a
dplyrpipeline that- Adds a new column (using
mutateand your function) that contains masses calculated from the diameters - Groups the data frame into species using the
SpCodecolumn - And then calculates biomass (i.e., the
sumof the masses) for each species (usingsummarize) - Stores the result as a data frame
- Adds a new column (using
- Display the resulting data frame
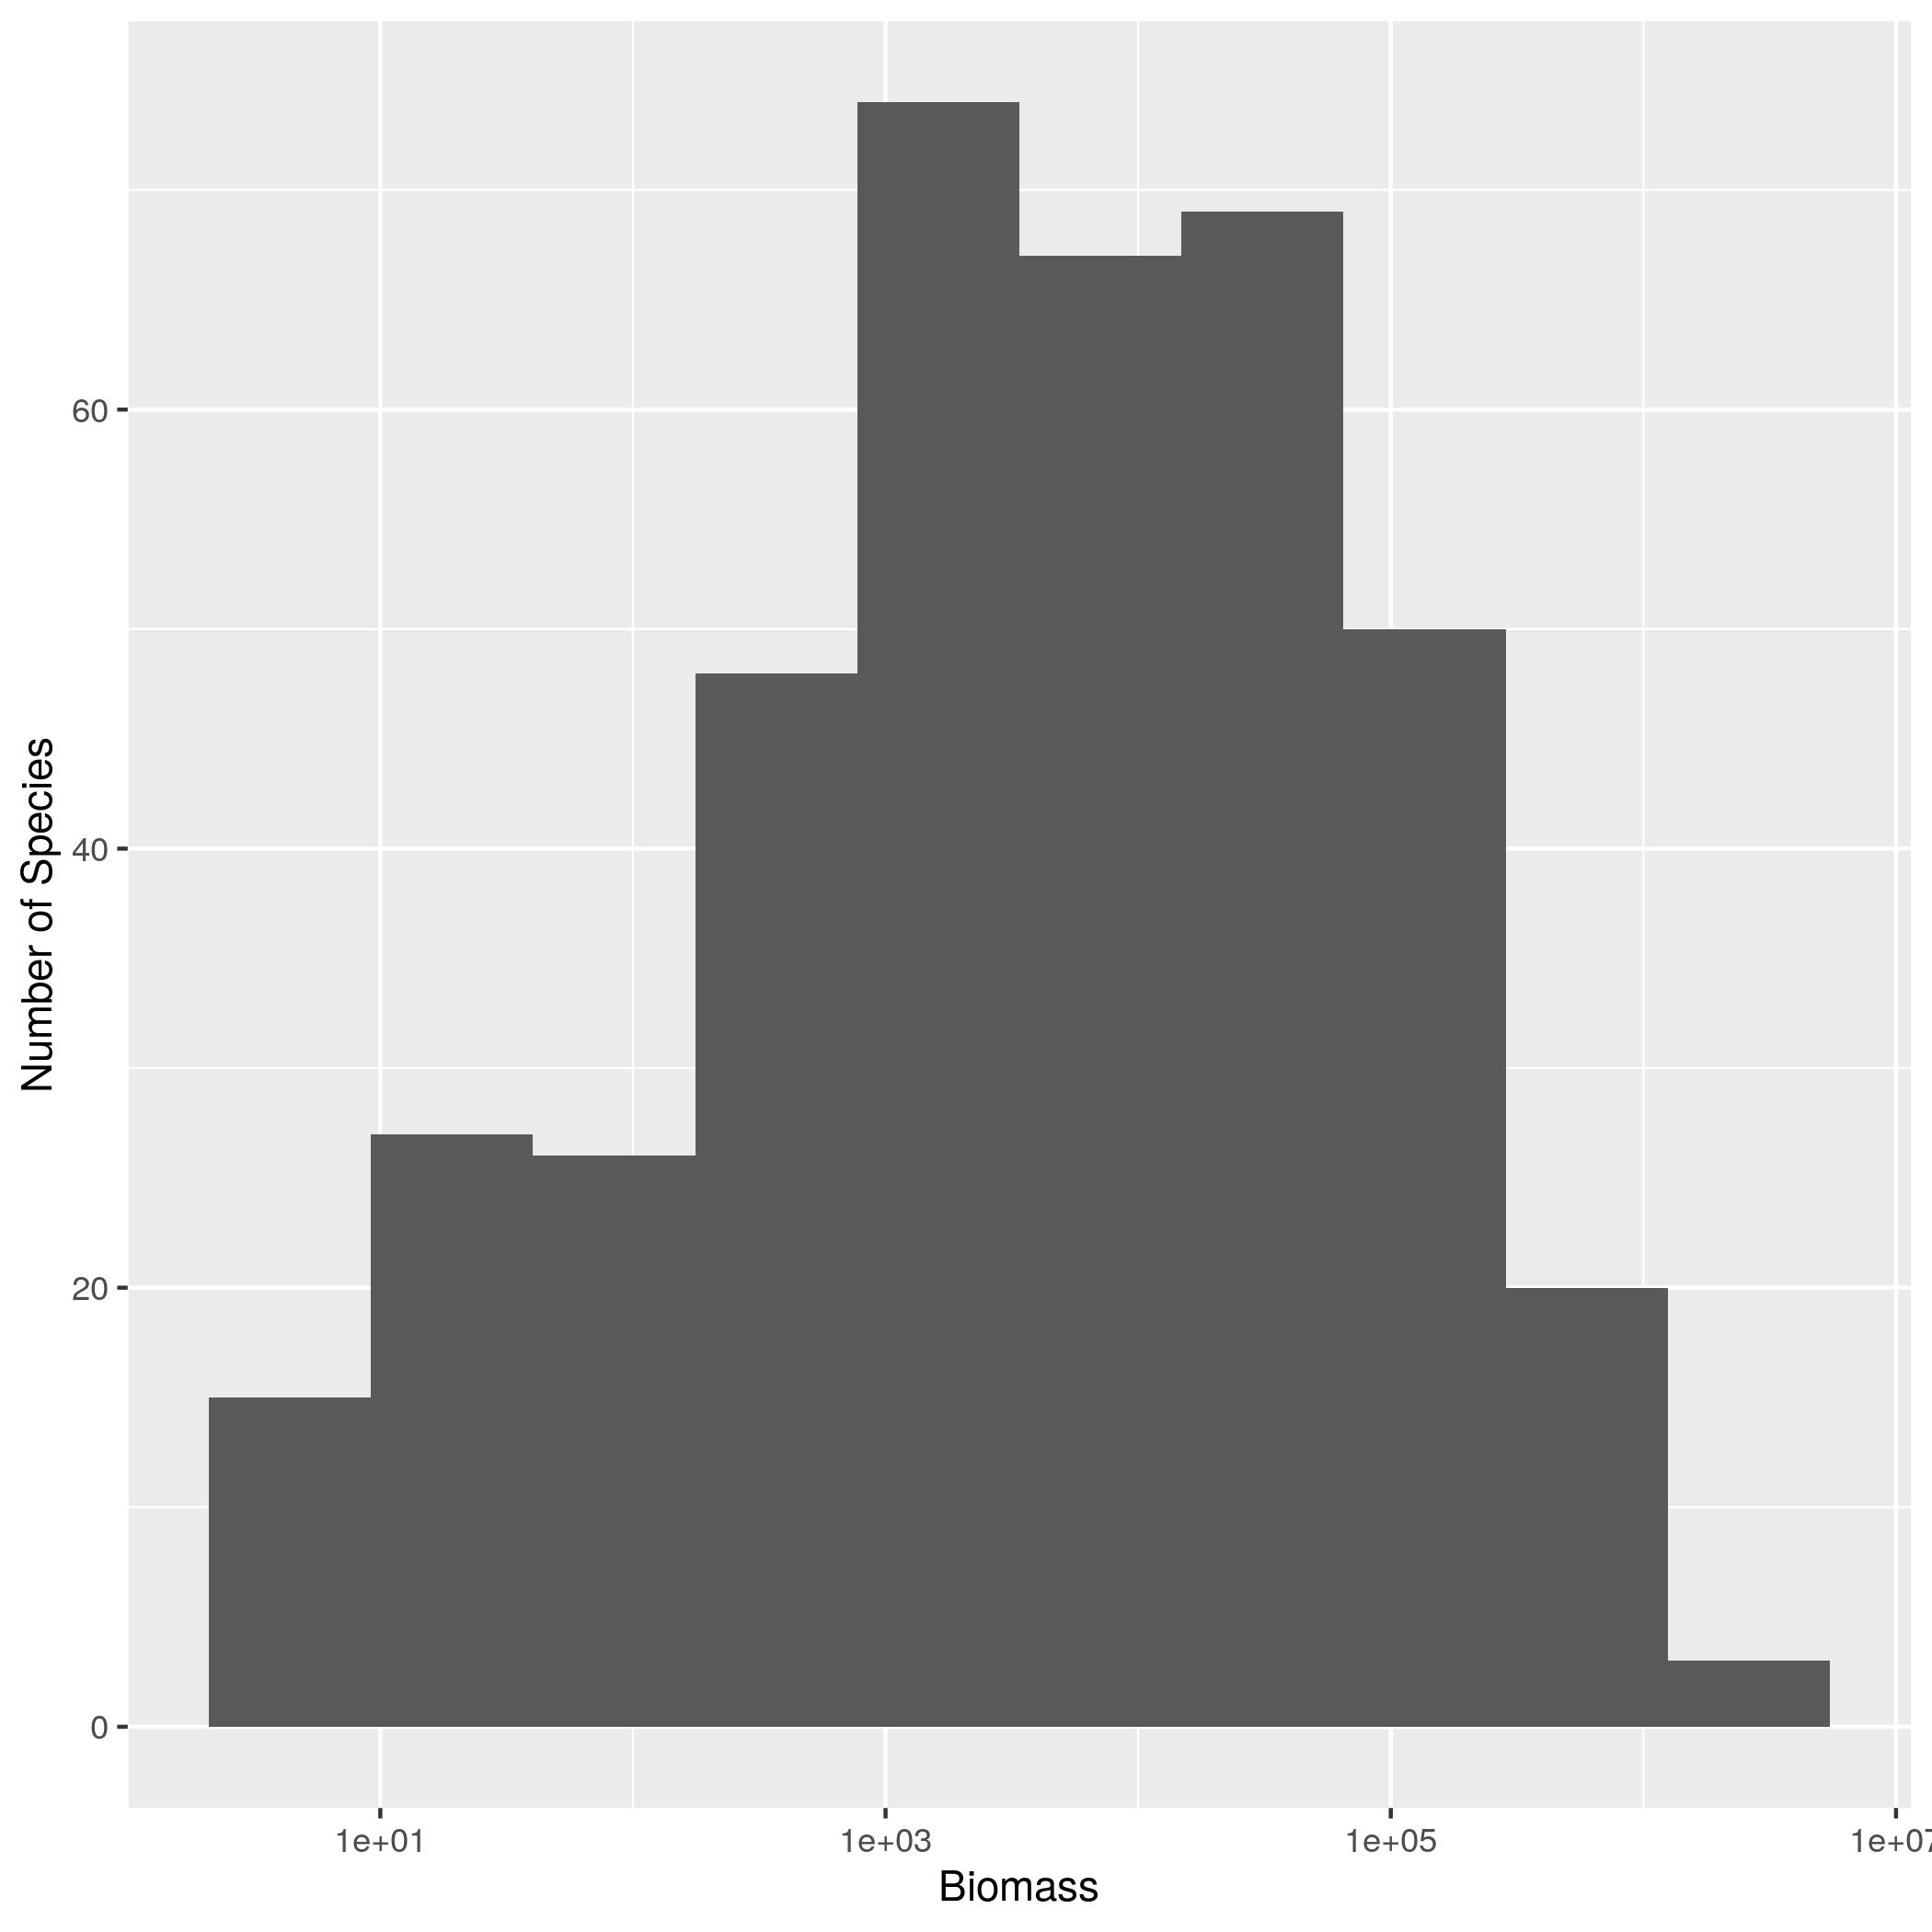
2. Plot a histogram of the species biomass values you just calculated.
- Use 10 bins in the histogram (using the
binsargument) - Use a log10 scale for the x axis (using
scale_x_log10) - Change the x axis label to
Biomassand the y axis label toNumber of Species(usinglabs)
Crown Volume Calculation (optional)
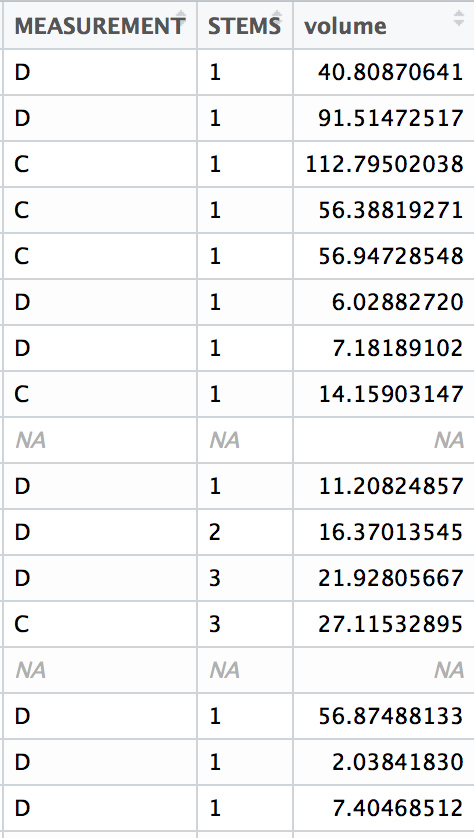
The UHURU experiment in Kenya has conducted a survey of Acacia and other tree species in ungulate exclosure treatments. Data for the tree data is available here in a tab delimited (
"\t") format. Each of the individuals surveyed were measured for tree height (HEIGHT) and canopy size in two directions (AXIS_1andAXIS_2). Read these data in using the following code:tree_data <- read.csv("http://www.esapubs.org/archive/ecol/E095/064/TREE_SURVEYS.txt", sep = '\t', na.strings = c("dead", "missing", "MISSING", "NA", "?", "3.3."), stringsAsFactors = FALSE)You want to estimate the crown volumes for the different species and have developed equations for species in the Acacia genus:
volume = 0.16 * HEIGHT^0.8 * pi * AXIS_1 * AXIS_2and the Balanites genus:
volume = 1.2 * HEIGHT^0.26 * pi * AXIS_1 * AXIS_2For all other genera you’ll use a general equation developed for trees:
volume = 0.5 * HEIGHT^0.6 * pi * AXIS_1 * AXIS_2-
Write a function called
tree_volume_calcthat calculates the canopy volume for the Acacia species in the dataset. To do so, use an if statement in combination with thestr_detect()function from thestringrR package. The codestr_detect(SPECIES, "Acacia")will returnTRUEif the string stored in this variable contains the word “Acacia” andFALSEif it does not. This function will have to take the following arguments as input: SPECIES, HEIGHT, AXIS_1, AXIS_2. Then run the following line:tree_volume_calc("Acacia_brevispica", 2.2, 3.5, 1.12) -
Expand this function to additionally calculate canopy volumes for other types of trees in this dataset by adding if/else statements and including the volume equations for the Balanites genus and other genera. Then run the following lines:
tree_volume_calc("Balanites", 2.2, 3.5, 1.12)tree_volume_calc("Croton", 2.2, 3.5, 1.12) -
Now get the canopy volumes for all the trees in the
tree_datadataframe and add them as a new column to the data frame. You can do this usingtree_volume_calc()and eithermapply()or usingdplyrwithrowwiseandmutate.
-
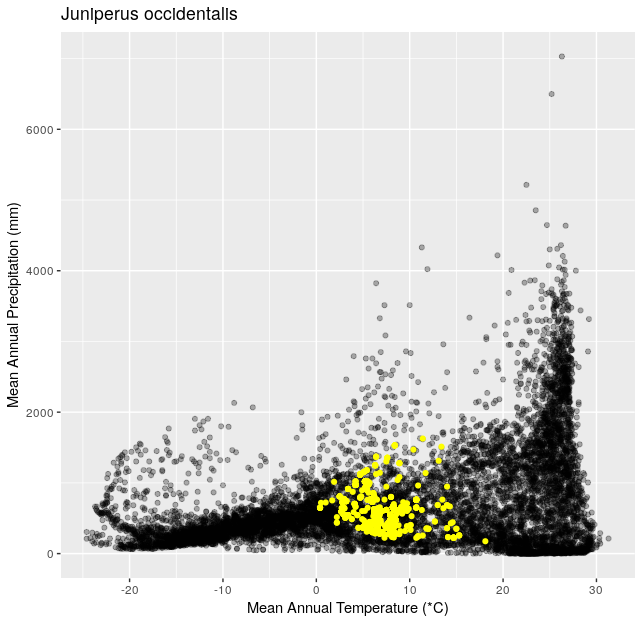
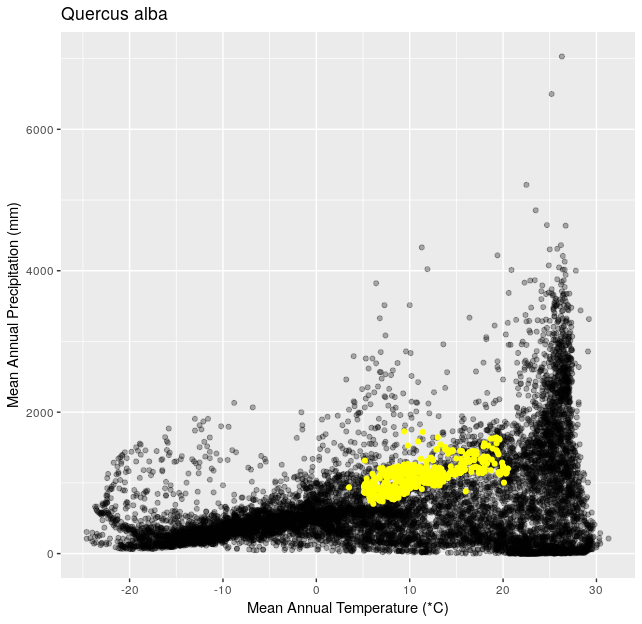
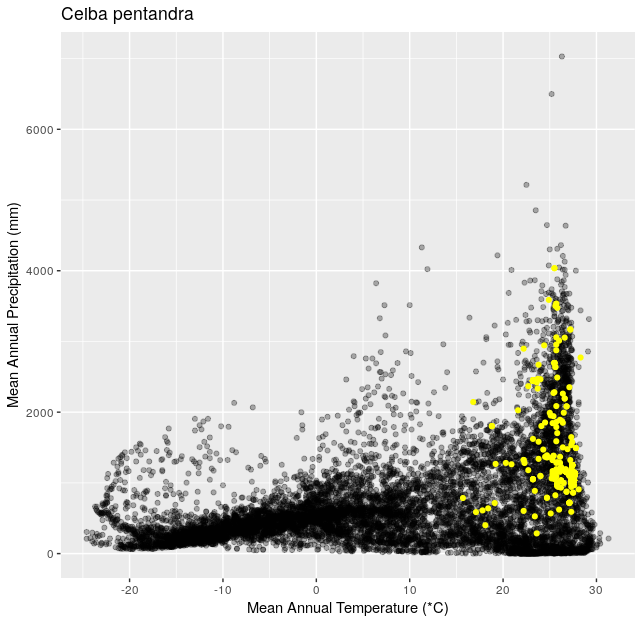
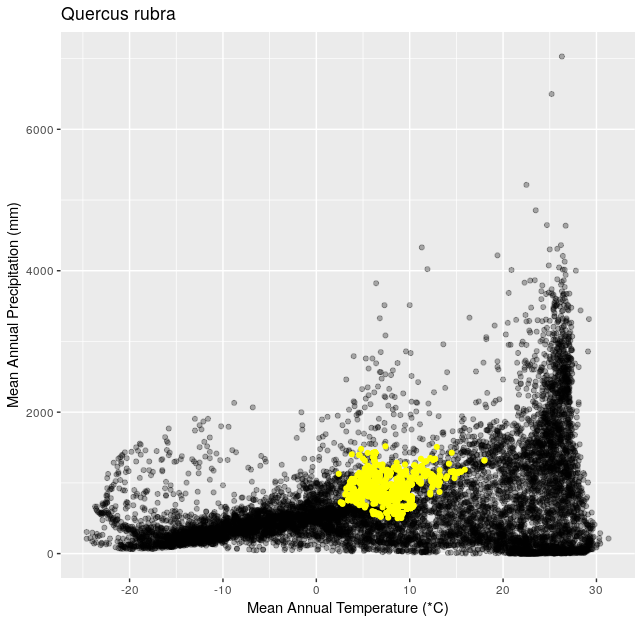
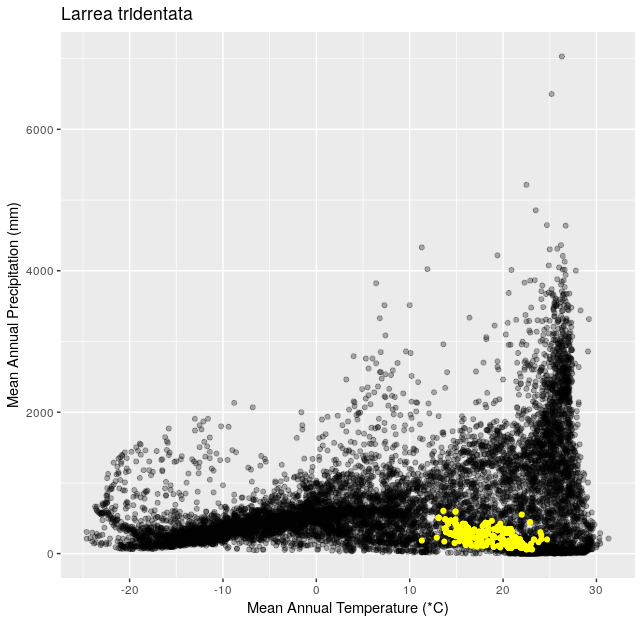
Climate Space Iteration (optional)
This is a follow up to Climate Space Rewrite.
Using the functions you created in Climate Space Rewrite iterate over the following list of species to create one plot per species from the list. Include a title for each plot that is the species name using the
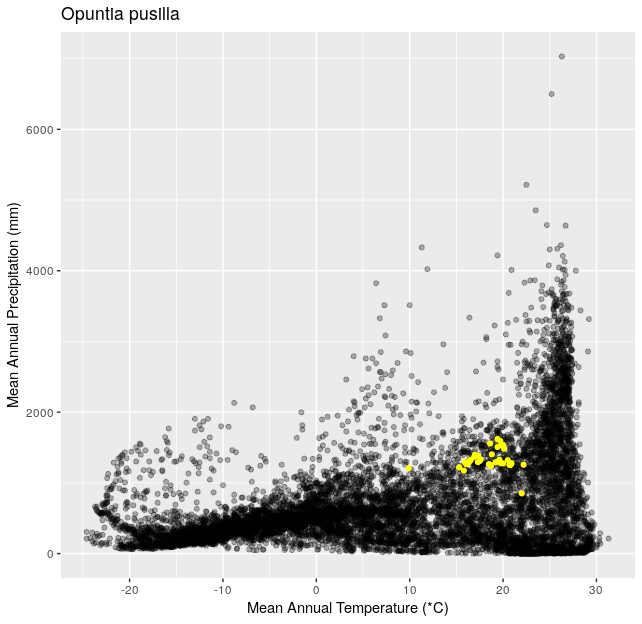
ggtitle()function. You can use any type of automated iteration that we’ve learned.[click here for output] [click here for output] [click here for output] [click here for output] [click here for output] [click here for output] [click here for output]species <- c("Juniperus occidentalis", "Quercus alba", "Picea glauca", "Ceiba pentandra", "Quercus rubra", "Larrea tridentata", "Opuntia pusilla")