
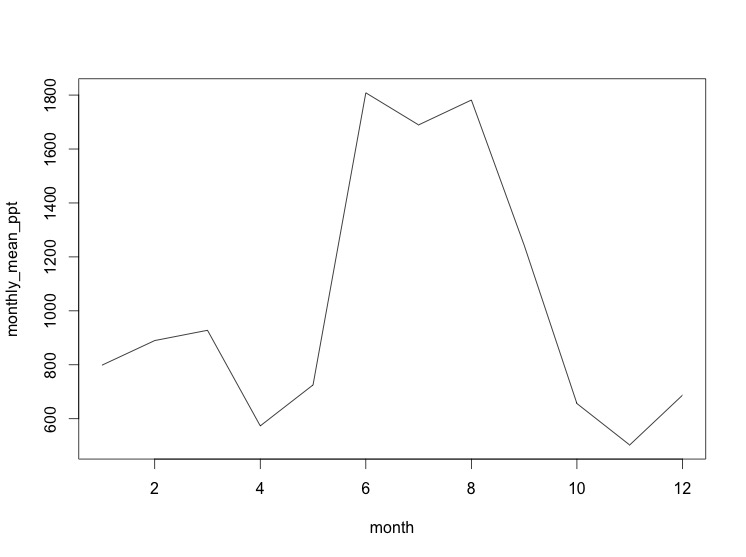
We are interested in understanding the monthly variation in precipitation in Gainesville, FL. We’ll use some data from the NOAA National Climatic Data Center.
Each row of the data file is a year (from 1961-2013) and each column is a month (January - December).
Rearrange the following program so that it:
Finally, add a comment above the code that describes what it does. The comment
character in R is #.
It’s OK if you don’t know exactly how the details of the program work at this point, you just need to figure out the right order of the lines based on when variables are defined and when they are used.
plot(monthly_mean_ppt, type = "l", xlab = "Month", ylab = "Mean Precipitation")
monthly_mean_ppt <- colMeans(ppt_data)
ppt_data <- read.csv("https://datacarpentry.org/semester-biology/data/gainesville-precip.csv", header = FALSE)